MitImpact 3 collects genomic, clinical and functional annotations for all possible human missense variants. The latest release focuses on variant interactions, by providing scores of sequence co-variation and effect compensation.

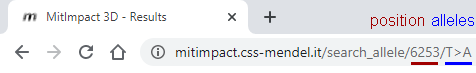
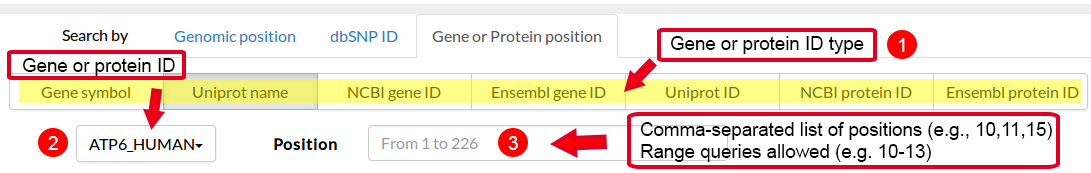
It is thus possible to specify a genomic position and a variant, in the form REF>ALT, straight in the browser. If valid, this request will redirect to the result page, where the information about this variant will be displayed in the first tab.

| # | Gene Symbol | Ensembl Gene ID | Ensembl Protein ID | Uniprot Name | Uniprot ID | Ncbi Gene ID | Ncbi Protein ID |
|---|---|---|---|---|---|---|---|
| 1 | MT-ND1 | ENSG00000198888 | ENSP00000354687 | NU1M_HUMAN | P03886 | 4535 | YP_003024026.1 |
| 2 | MT-ND2 | ENSG00000198763 | ENSP00000355046 | NU2M_HUMAN | P03891 | 4536 | YP_003024027.1 |
| 3 | MT-ND3 | ENSG00000198840 | ENSP00000355206 | NU3M_HUMAN | P03897 | 4537 | YP_003024033.1 |
| 4 | MT-ND4 | ENSG00000198886 | ENSP00000354961 | NU4M_HUMAN | P03905 | 4538 | YP_003024031.1 |
| 5 | MT-ND4L | ENSG00000212907 | ENSP00000354728 | NU4LM_HUMAN | P03901 | 4539 | YP_003024034.1 |
| 6 | MT-ND5 | ENSG00000198786 | ENSP00000354813 | NU5M_HUMAN | P03915 | 4540 | YP_003024036.1 |
| 7 | MT-ND6 | ENSG00000198695 | ENSP00000354665 | NU6M_HUMAN | P03923 | 4541 | YP_003024037.1 |
| 8 | MT-ATP6 | ENSG00000198899 | ENSP00000354632 | ATP6_HUMAN | P00846 | 4508 | YP_003024031.1 |
| 9 | MT-ATP8 | ENSG00000228253 | ENSP00000355265 | ATP8_HUMAN | P03928 | 4509 | YP_003024030.1 |
| 10 | MT-CO1 | ENSG00000198804 | ENSP00000354499 | COX1_HUMAN | P00395 | 4512 | YP_003024028.1 |
| 11 | MT-CO2 | ENSG00000198712 | ENSP00000354876 | COX2_HUMAN | P00403 | 4513 | YP_003024029.1 |
| 12 | MT-CO3 | ENSG00000198938 | ENSP00000354982 | COX3_HUMAN | P00414 | 4514 | YP_003024032.1 |
| 13 | MT-CYB | ENSG00000198727 | ENSP00000354554 | CYB_HUMAN | P00156 | 4519 | YP_003024038.1 |
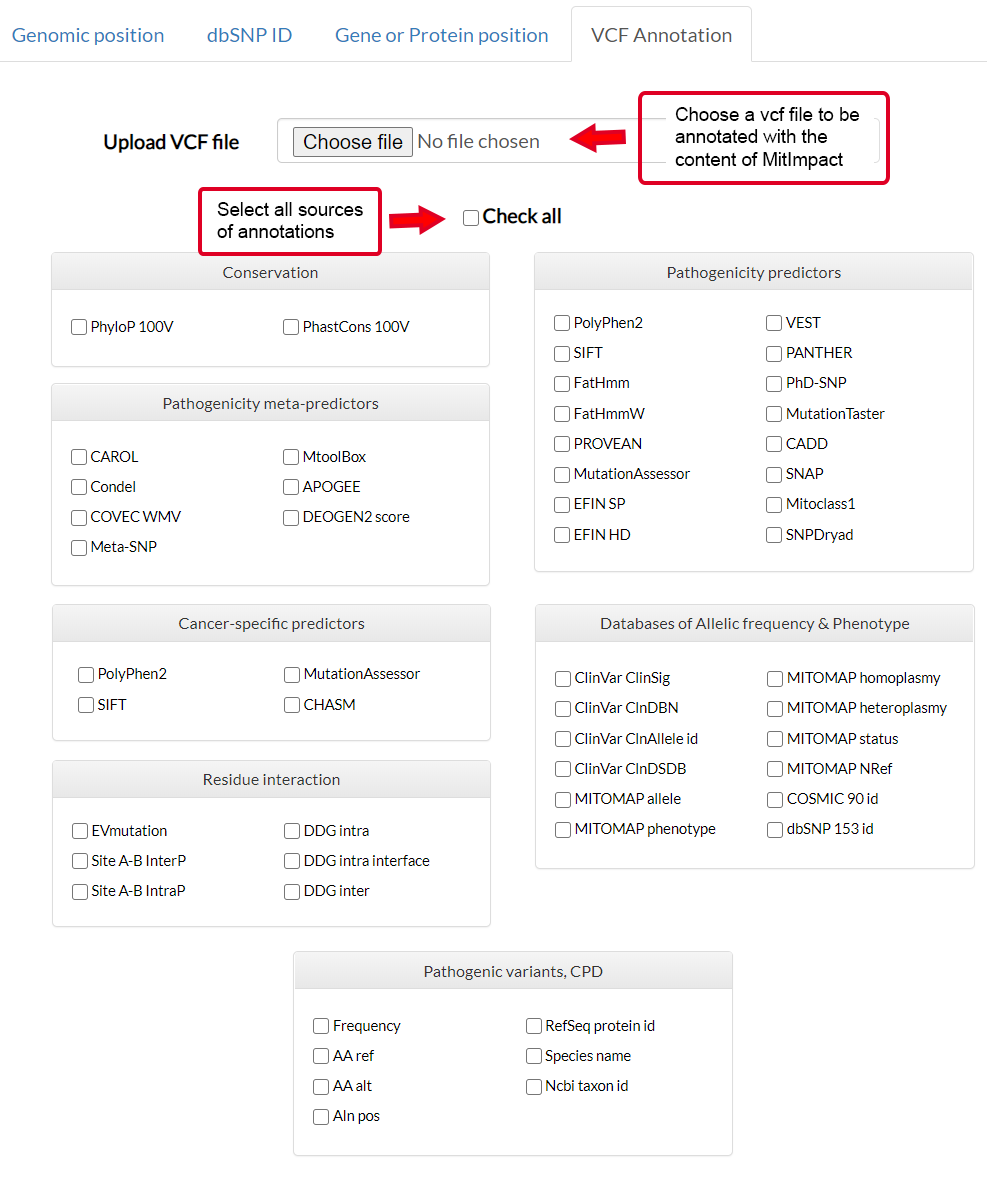
The putative effect of missense mutations within the 13 mitochondrially-encoded proteins was calculated by the following missense pathogenicity predictors:
Mutations were also annotated by these meta-predictors:
Predictions can be obtained from the following web URLs:
APOGEE 2
APOGEE 2 is a mitochondrially-centered ensemble method resulting from a 20-fold cross-validation
repeated five times, where 19 folds of its training set were iteratively used for the training
and tuning of the hyperparameters of a KNN RusSmote ML algorithm and the remaining fold was
used for testing. The performance of the method was assessed after selecting the best set
of hyperparameters. This was done using an inner 10-fold Grid-Search cross-validation.
An
extensive description can be found here.
APOGEE 2 aggregates information of the following predictors and features:
APOGEE 2 refers to five pathogenicity classes: benign, likely-benign, VUS,
likely-pathogenic, and pathogenic, which are inferred from a pathogenicity
probability provided by APOGEE, which, in turn, is calculated on the KNN RusSmote-relative
prediction score.
Score/probability thresholds are represented in this figure:

Please note that:
| Method | MCC | Precision | auPR curve | auROC curve | Accuracy | Balanced accuracy | Sensitivity | Specificity |
| MetaSNP | 0.323 | 0.195 | 0.448 | 0.883 | 0.721 | 0.790 | 0.871 | 0.709 |
| CAROL | 0.329 | 0.209 | 0.235 | 0.827 | 0.754 | 0.785 | 0.821 | 0.749 |
| Condel | 0.283 | 0.160 | 0.249 | 0.832 | 0.629 | 0.767 | 0.929 | 0.605 |
| COVEC WMV | 0.376 | 0.239 | 0.307 | 0.867 | 0.787 | 0.816 | 0.850 | 0.782 |
| MToolBox DS | 0.277 | 0.156 | 0.439 | 0.889 | 0.621 | 0.762 | 0.929 | 0.596 |
| APOGEE 1 | 0.385 | 0.266 | 0.573 | 0.855 | 0.823 | 0.802 | 0.779 | 0.826 |
| APOGEE 2 | 0.569 ± 0.041 | 0.431 ± 0.035 | 0.716 ± 0.054 | 0.95 ± 0.016 | 0.9 ± 0.011 | 0.888 ± 0.027 | 0.874 ± 0.053 | 0.903 ± 0.011 |
Pairwise co-variation analyses was implemented using two alternate methods implemented in I-COMS (http://i-coms.leloir.org.ar). For each pair of the subunits of every Respiratory Chain Complex (e.g. CO1 vs. CO2, CO2 vs CO3, CO1 vs CO3 for Complex IV), the tool allows to:
The top500 (cutoff suggested by the I-COMS authors) high-scoring site pairs were retained: those whose members are located into the two distinct proteins are named inter-protein. Top500 high scoring pairs were defined intra-protein if both the variants fell into the same queried protein (which was concatenated with ND1 by default). Note that a certain protein site could have different intra-protein or inter-protein co-varying site partners. Furthermore, site co-variation does not necessarily imply the existence of any real functional or evolutionary relationship. I-COMS was used here because of its simplicity, completeness and responsivity.
Raw I-COMS score matrices and protein alignments relative to the current version of MitImpact and generated using I-COMS are available from this link.
CPDs are amino acid substitutions that are reported to be pathogenic in the human population, but occur as wild-type residues in non-human ortholog proteins. We identified mitochondrial CPDs by:
For each putative CPD, we have then defined the:
Inter and intra-protein relationships between co-varying variants were investigated energetically. FoldX 4.0 was used to calculate the free-energy changes upon mutation of residues lying at the interaction interface. Alternative amino acids that caused a ΔΔG to exceed the cutoff suggested by the authors (±0.61 Kcal/mol) for the single mutant were tagged as disruptive. Pairs of mutants with ΔΔG conservatively close to zero (< ±0.1 Kcal/mol) were considered as structurally compensative.
In particular, MitImpact reports:
As a pilot study, we have selected all pairs of variants obtained with I-COMS and predicted to be energetically compensative, where at least one of the pairs was reported as pathogenetic in the MITOMAP database. For these pairs, we looked for the corresponding human 3D structures into the Protein Data Bank and investigated the interacting properties of the wild-type complex as well as of the single and double-mutated complexes. We then ran ten replicas of four independent classical molecular dynamics simulations of 50 nanoseconds (cf. methods here).
With the aim to understand whether a protein carrying the two mutations of a pair was stable and close to the wild-type structure, the following measures were calculated on the simulation trajectories: