Leigh Disease is a very rare and severe mitochondrial disorder that arises in the first months of life; it has been associated with at least 75 nuclear and mitochondrially encoded genes with functional implications in mitochondrial biogenesis and metabolism (1). The disease is characterized by neurological regression with specific clinical lesions at basal ganglia and brainstem levels.
A mutation in the ND3 gene, m.10191T>C, has been associated with severe Complex I deficiency and neurological degeneration in adult patients (2) and children with Leigh disease (3,4). The mutation encodes for a Serine-Proline substitution in position 45. This missense variant is classified as Confirmed pathogenic mutation in MITOMAP, with Leigh Disease and Leigh Disease-like associated phenotypes.
We asked ourselves if theoretical compensatory variants exist for such mutation, within the same protein or in the interaction interface with another mitochondrial protein.
As a first step, we obtained 87 possibly inter-protein co-evolving pairs involving the site 45 of ND3. We considered only the pairs mapping on the physical interface between ND3 and ND1 and retrieved three PDB structures that resolved their interaction interface. Then, we calculated the ∆∆G of binding energy through the FoldX suite. ∆∆GA is the binding energy variation of the S45P mutant concerning the wild type ND3 protein; ∆∆GB is the partner mutant's binding energy variation for the wild type ND1 protein; ∆∆GAB is the binding energy variation when both proteins are mutated at their interaction interface. Note that ∆∆GA is below the conventional threshold of ±0.61 Kcal/mol that identifies the disruptive variants for two PDB complexes, 5lc5 and 5ldx. We evidenced that three amino acid changes in the ND1 position 126 can restore the binding energy to, approximately, wild type levels (row in bold characters in the table below). Indeed, ∆∆GAB is proximal to 0, indicating that the interface with two co-occurring variations has similar binding energy to the wild-type protein complex.
|
Interactor |
PDB ID |
Chain (A protein) |
Chain (B protein) |
Object variant (A) |
Partner variant (B) |
∆∆G AB |
∆∆G A |
∆∆G B |
|
MT-ND1 |
5lc5 |
A |
H |
S45P |
A64P |
2.340 |
-1.091 |
3.391 |
|
MT-ND1 |
5lc5 |
A |
H |
S45P |
A64D |
-1.071 |
-1.091 |
0.005 |
|
MT-ND1 |
5lc5 |
A |
H |
S45P |
A64G |
-1.410 |
-1.091 |
-0.339 |
|
MT-ND1 |
5lc5 |
A |
H |
S45P |
A64V |
-0.870 |
-1.091 |
0.204 |
|
MT-ND1 |
5lc5 |
A |
H |
S45P |
A64S |
-1.098 |
-1.091 |
-0.015 |
|
MT-ND1 |
5lc5 |
A |
H |
S45P |
A64T |
-0.923 |
-1.091 |
0.207 |
|
MT-ND1 |
5lc5 |
A |
H |
S45P |
K62Q |
-1.358 |
-1.091 |
-0.241 |
|
MT-ND1 |
5lc5 |
A |
H |
S45P |
K62T |
-0.341 |
-1.091 |
0.832 |
|
MT-ND1 |
5lc5 |
A |
H |
S45P |
K62M |
-1.309 |
-1.091 |
-0.217 |
|
MT-ND1 |
5lc5 |
A |
H |
S45P |
K62E |
-0.630 |
-1.091 |
0.412 |
|
MT-ND1 |
5lc5 |
A |
H |
S45P |
K62N |
-0.312 |
-1.091 |
0.846 |
|
MT-ND1 |
5lc5 |
A |
H |
S45P |
N126K |
-0.063 |
-1.091 |
0.553 |
|
MT-ND1 |
5lc5 |
A |
H |
S45P |
N126D |
1.607 |
-1.091 |
1.595 |
|
MT-ND1 |
5lc5 |
A |
H |
S45P |
N126I |
-1.125 |
-1.091 |
0.053 |
|
MT-ND1 |
5lc5 |
A |
H |
S45P |
N126Y |
0.031 |
-1.091 |
0.641 |
|
MT-ND1 |
5lc5 |
A |
H |
S45P |
N126T |
0.129 |
-1.091 |
0.124 |
|
MT-ND1 |
5lc5 |
A |
H |
S45P |
N126S |
0.097 |
-1.091 |
0.245 |
|
MT-ND1 |
5lc5 |
A |
H |
S45P |
N126H |
0.487 |
-1.091 |
0.694 |
|
MT-ND1 |
5ldw |
A |
H |
S45P |
A64P |
1.517 |
-0.288 |
1.892 |
|
MT-ND1 |
5ldw |
A |
H |
S45P |
A64D |
-0.286 |
-0.288 |
0.016 |
|
MT-ND1 |
5ldw |
A |
H |
S45P |
A64G |
-0.586 |
-0.288 |
-0.290 |
|
MT-ND1 |
5ldw |
A |
H |
S45P |
A64V |
-0.201 |
-0.288 |
0.074 |
|
MT-ND1 |
5ldw |
A |
H |
S45P |
A64S |
-0.314 |
-0.288 |
-0.001 |
|
MT-ND1 |
5ldw |
A |
H |
S45P |
A64T |
-0.184 |
-0.288 |
0.101 |
|
MT-ND1 |
5ldw |
A |
H |
S45P |
K62Q |
-0.302 |
-0.288 |
-0.029 |
|
MT-ND1 |
5ldw |
A |
H |
S45P |
K62T |
-0.157 |
-0.288 |
0.183 |
|
MT-ND1 |
5ldw |
A |
H |
S45P |
K62M |
-0.296 |
-0.288 |
-0.012 |
|
MT-ND1 |
5ldw |
A |
H |
S45P |
K62E |
0.035 |
-0.288 |
0.301 |
|
MT-ND1 |
5ldw |
A |
H |
S45P |
K62N |
0.175 |
-0.288 |
0.465 |
|
MT-ND1 |
5ldw |
A |
H |
S45P |
N126K |
-0.131 |
-0.288 |
-0.182 |
|
MT-ND1 |
5ldw |
A |
H |
S45P |
N126D |
0.960 |
-0.288 |
0.906 |
|
MT-ND1 |
5ldw |
A |
H |
S45P |
N126I |
-0.791 |
-0.288 |
0.457 |
|
MT-ND1 |
5ldw |
A |
H |
S45P |
N126Y |
-0.186 |
-0.288 |
0.152 |
|
MT-ND1 |
5ldw |
A |
H |
S45P |
N126T |
-0.684 |
-0.288 |
-0.612 |
|
MT-ND1 |
5ldw |
A |
H |
S45P |
N126S |
-0.479 |
-0.288 |
-0.494 |
|
MT-ND1 |
5ldw |
A |
H |
S45P |
N126H |
0.112 |
-0.288 |
0.233 |
|
MT-ND1 |
5ldx |
A |
H |
S45P |
A64P |
4.036 |
0.854 |
3.812 |
|
MT-ND1 |
5ldx |
A |
H |
S45P |
A64D |
0.685 |
0.854 |
-0.011 |
|
MT-ND1 |
5ldx |
A |
H |
S45P |
A64G |
0.442 |
0.854 |
-0.325 |
|
MT-ND1 |
5ldx |
A |
H |
S45P |
A64V |
0.603 |
0.854 |
-0.005 |
|
MT-ND1 |
5ldx |
A |
H |
S45P |
A64S |
0.748 |
0.854 |
-0.004 |
|
MT-ND1 |
5ldx |
A |
H |
S45P |
A64T |
0.884 |
0.854 |
0.107 |
|
MT-ND1 |
5ldx |
A |
H |
S45P |
K62Q |
0.700 |
0.854 |
0.015 |
|
MT-ND1 |
5ldx |
A |
H |
S45P |
K62T |
0.634 |
0.854 |
0.109 |
|
MT-ND1 |
5ldx |
A |
H |
S45P |
K62M |
0.680 |
0.854 |
0.050 |
|
MT-ND1 |
5ldx |
A |
H |
S45P |
K62E |
1.136 |
0.854 |
0.575 |
|
MT-ND1 |
5ldx |
A |
H |
S45P |
K62N |
1.255 |
0.854 |
0.452 |
|
MT-ND1 |
5ldx |
A |
H |
S45P |
N126K |
0.519 |
0.854 |
0.152 |
|
MT-ND1 |
5ldx |
A |
H |
S45P |
N126D |
1.809 |
0.854 |
1.314 |
|
MT-ND1 |
5ldx |
A |
H |
S45P |
N126I |
0.203 |
0.854 |
0.753 |
|
MT-ND1 |
5ldx |
A |
H |
S45P |
N126Y |
0.866 |
0.854 |
0.512 |
|
MT-ND1 |
5ldx |
A |
H |
S45P |
N126T |
0.133 |
0.854 |
-0.200 |
|
MT-ND1 |
5ldx |
A |
H |
S45P |
N126S |
0.433 |
0.854 |
-0.153 |
|
MT-ND1 |
5ldx |
A |
H |
S45P |
N126H |
1.079 |
0.854 |
0.557 |
The effect of ND3-ND1 interactions can also be observed in the Molecular Dynamics section of the MitImpact website. MD16, MD29, and MD31 collect results obtained by MD simulations of the amino acid pairs involving the positions 45 and 126 in ND3 and ND1, respectively.
Some interesting results about the S45P-N126S variant pairs regard:
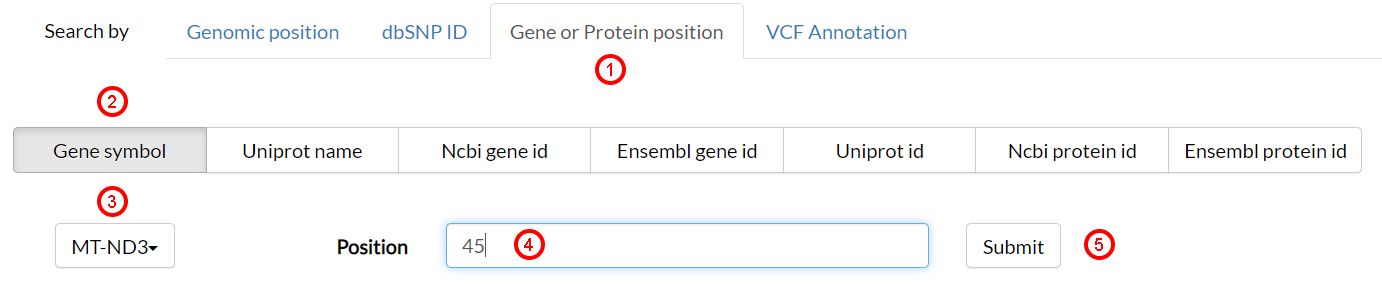
From within the MitImpact home page, select Search by Gene or Protein position(1) and click on the Gene symbol(2) button. Select MT-ND3(3) from the drop-down menu, then type 45(4) as position and click Submit(5).
The rsults page shows, in a multi-tab menu, all possible genomic variants that may occur in position 45 of the protein ND2. Select the variant 10191 (T>C)(6).
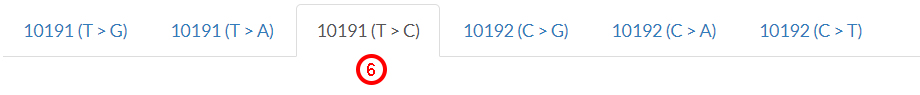
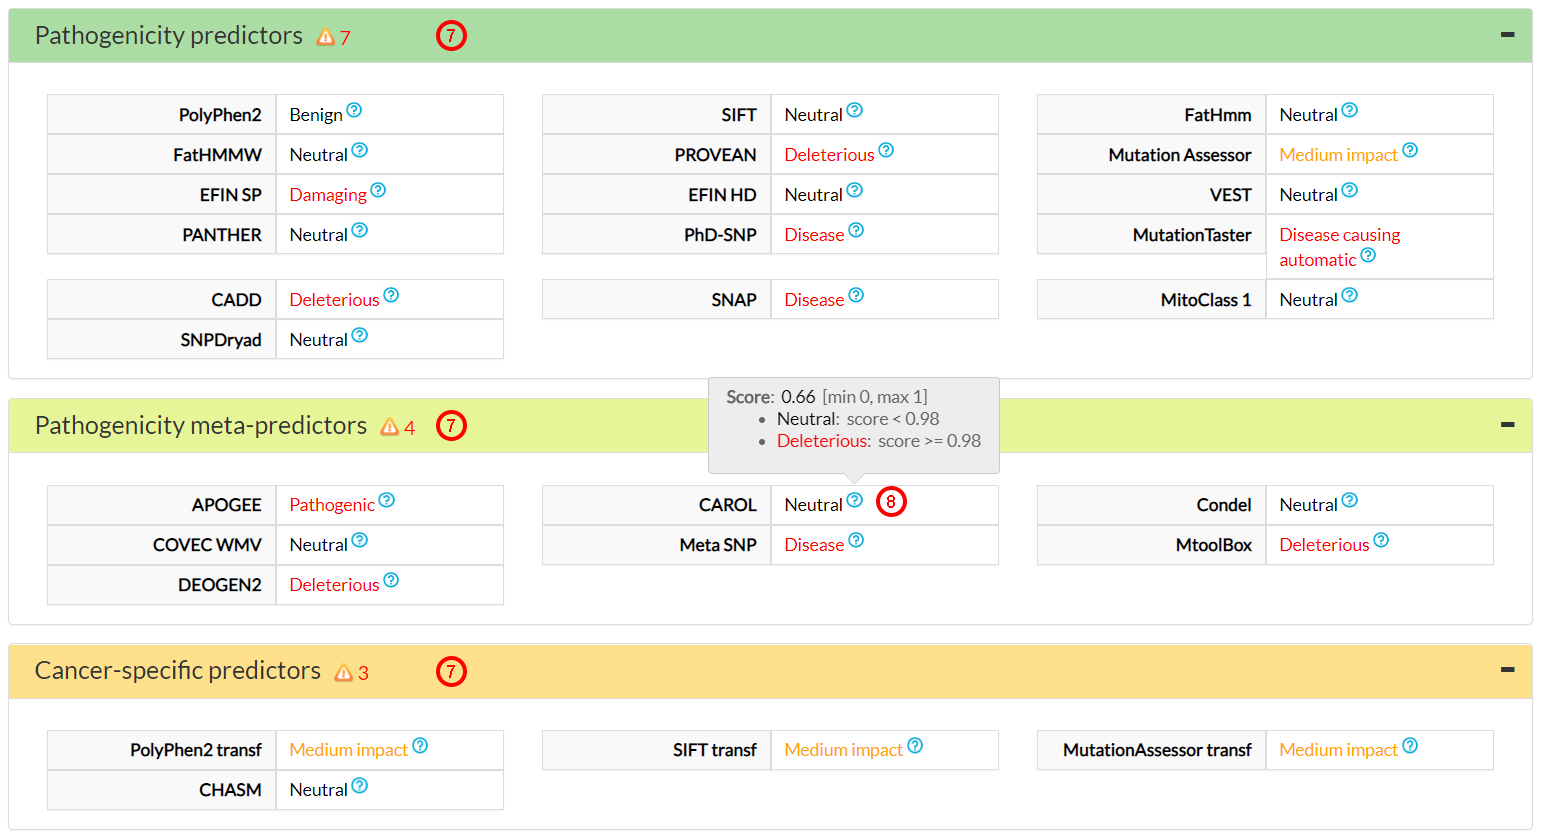
Data in the results page will be updated for the selected variant, which willbe shown to encode for
the S45P amino acid change. Looking at the pathogenicity predictors (7),
we can visualize pre-computed results from many computational algorithms. Clicking on the ? symbol (8),
we obtain details for score and score interpretation.
Note that score thresholds are not dogmatic,
i.e, they do not definitely separate neutral from pathogenic variants. Given the heterogeneity of predictions,
we suggest to consider recent meta-predictors (i.e., APOGEE, Deogen2, MtoolBox,
and Meta-SNP) for the classification of target variants.
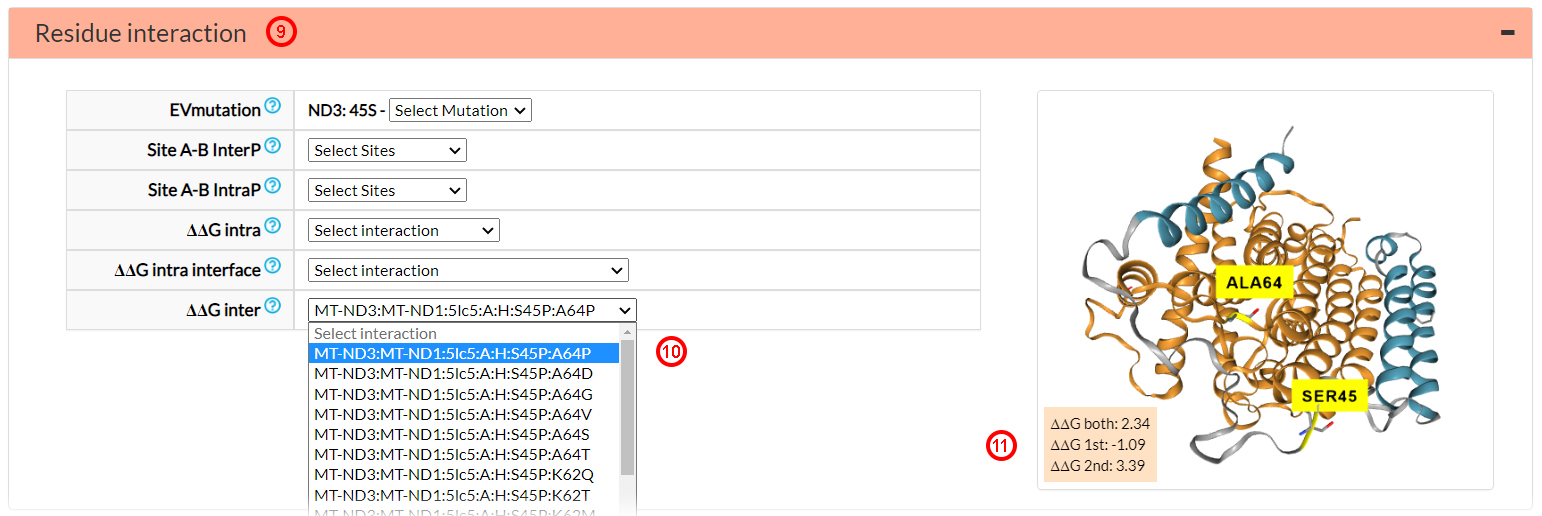
MitImpact 3 moves from single variant prediction to inferred binary interactions, as collected in
the Residue interaction(9) section. There, you can
visualize the ∆∆G for single and wild-type protein mutants through the drop-down menus labeled
∆∆G intra, ∆∆G intra interface, and ∆∆G inter sections.
The first variant pair in the ∆∆G inter menu is ND3 S45P vs. ND1 A64P (10),
which was studied in the 5lc5 PDB structure.
∆∆G 1st and ∆∆G 2nd are both > |0.61| (11), then
significantly altering the binding energy
of the complex. ∆∆G both for the double mutant is
2.34 Kcal/mol(11), very far from 0, meaning
that native ∆∆G is not restored by the co-occurrence of the two mutations (S45P and A64P).
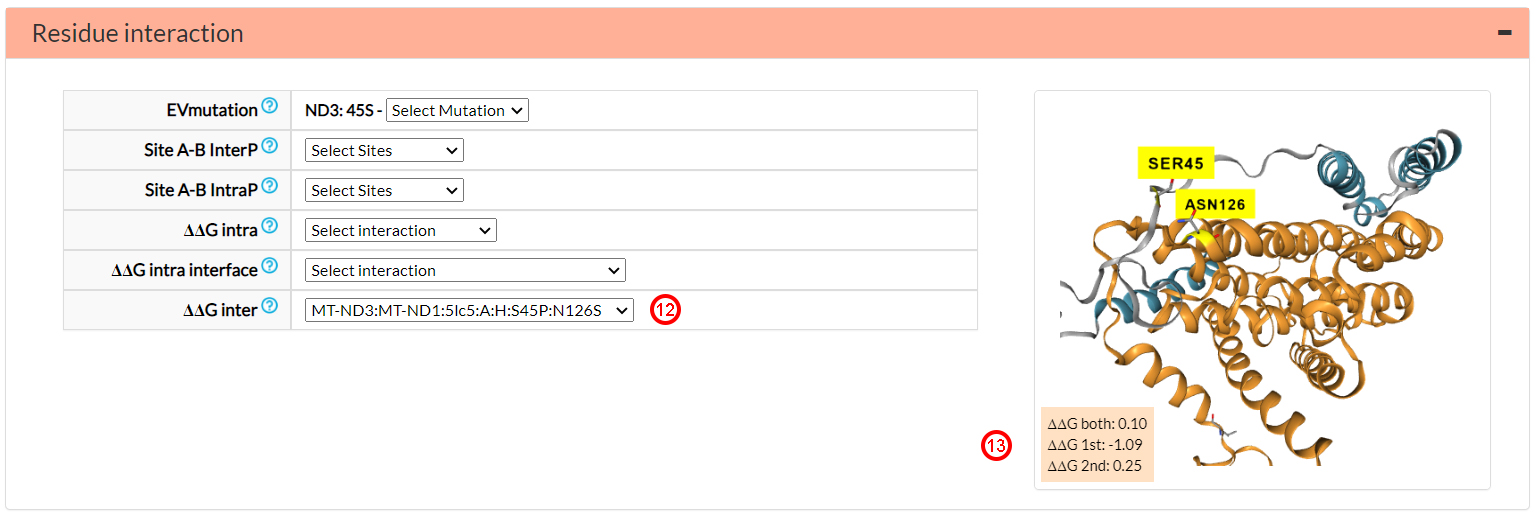
Selecting the partner N126S (12), instead, we can see that the
S45P variant (∆∆G 1st) considerably alters
the binding energy (-1.09 Kcal/mol)(13),
while N126S on the ND1 subunit has a lower effect (∆∆G 2nd = 0.25)(13).
The global effect of the two mutations in the ND3-ND1 interface is ∆∆G both = 0.1(13).
We recall that if -0.1 ≤ ∆∆Gboth ≤ 0.1,
then the two variants can be considered structurally compensated.
The potential compensatory effects on interesting missense variants can thus be retrieved by exploring
the Residue interaction section. The users can download the flat file version of out
MitImpact 3 database and evaluate the fields ΔΔG intraP, ΔΔG intraP interface, ΔΔG interP.
Further eetails on can be found in the Output legend page.